Embed your maps in Power BI, Tableau or your favorite BI tool


Business Intelligence tools are great at charts, tables, and KPIs, but most of them struggle with maps. A lot of business data has a location component, and a flat table hides the patterns a map makes obvious. That is the gap CARTO fills: a cloud-native spatial analytics and visualization platform that adds the maps your BI dashboards are missing, running on the data you already keep in your cloud data warehouse.
Spatial limitations of BI platforms and the alternative
BI tools excel in handling numerical and categorical data, providing a range of visualization options for these data types. However, when it comes to spatial data, these tools often lack the capabilities to effectively represent and analyze location-based information. This limitation holds businesses back from getting the full value of their data, especially in industries where location plays a central role, such as telco, insurance, and logistics.
CARTO closes this gap with tools for visualizing and analyzing geospatial data. By embedding interactive maps built in CARTO into BI platforms like Looker Studio, Tableau, or Power BI, teams give their analysts and business users a clearer view of spatial relationships and patterns.
In this blog post we will provide an overview of how simple it is for users to embed CARTO maps into their favorite BI tool in a straightforward way, making their BI dashboards and reports more engaging and informative thanks to highly scalable maps running on their data warehouse. And with CARTO's move toward Agentic GIS, the same maps and spatial analysis can be created from natural language within your data warehouse, then surfaced inside the BI dashboards your teams already use.
Accessing your map URL and embed code
To embed a CARTO map in your BI tool, you will first need to access your map's URL and/or embed code. To do that, in the map sharing settings, first share your map either within your organization, with specific user groups, or publicly. The map link offers you a direct URL to your map, with support for URL parameters to provide a more tailored experience. Alternatively, you can also get an embed code that is provided in the “Developers and embedding” section of the sharing settings of the map. This embed code can be copied and pasted into the HTML of your site or application.
CARTO has since added two options worth knowing about for BI dashboards. You can use authenticated (private) embeds, so a map shared only within your organization can go into an internal dashboard without making it public. And embedded maps can listen to and send reactive events, so the map can respond to the selections and filters in the surrounding dashboard. See the embedding maps documentation for details.
Here are some examples of these resources to test this out:
- Map link: https://clausa.app.carto.com/map/5d942679-411f-4ab7-afb7-0f6061c9af63
- Embed code
<iframe width="640px" height="360px" src="https://clausa.app.carto.com/map/5d942679-411f-4ab7-0f6061c9af63"></iframe>
Embedding maps in BI tools
Embedding your CARTO maps into BI platforms is simple, and it will give your dashboards better capabilities to explore and analyze spatial data, and make data more accessible and engaging thanks to its interactivity. Most tools offer extensibility capabilities that allow you to embed HTML elements from external sources. In this section, we will show you how you can achieve that in some of the most commonly used BI tools today.
Power BI
In Power BI, you can embed a Builder map on your dashboard by following these steps:
- Start by setting up a new dashboard within Power BI.
- Make sure you are in editing mode to make changes to your dashboard.
- Look for the option to add a Web Content Tile to your dashboard.
- Configure the Web Content Tile as shown below and then click "Apply" to finalize the tile's setup.
- Set a title for your tile to indicate what the map represents.
- Include the embed code for your Builder map in the tile configuration:
<iframe width="640px" height="360px" src="https://clausa.app.carto.com/map/5d942679-411f-4ab7-0f6061c9af63"></iframe>
After these steps, your Builder map will be displayed as a Web Content Tile within your Power BI dashboard.
Tableau
Embedding a URL, such as a web map or any other web content, in Tableau is straightforward using the Web Page object in Tableau Dashboard. Here’s how you can do it:
- Open Tableau and go to the dashboard where you want to embed the URL.
- Select Web Page from the objects list at the bottom of the screen.
- Drag the Web Page object to your dashboard workspace.
- Enter the URL in the dialog box that appears. This is where you would paste the URL you wish to embed, such as your Builder map link: https://clausa.app.carto.com/map/5d942679-411f-4ab7-afb7-0f6061c9af63
- Click OK. Tableau will load the web content specified by the URL directly within the dashboard area you’ve selected.
Looker Studio
Embedding a Builder map in Looker Studio is simple with the URL embed functionality. Here’s how you can do it:
- In the toolbar, click <> URL embed.
- On the right, in the properties panel, select the SETUP tab.
- Enter the Builder map URL in the External Content URL field.
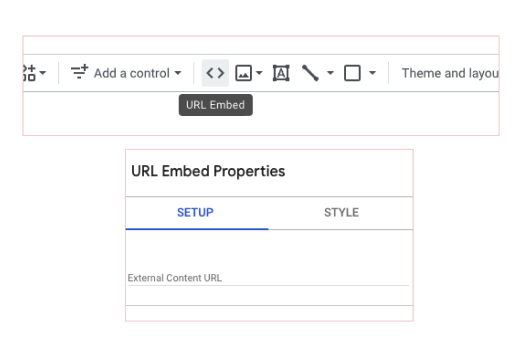
Once embedded, you have the freedom to further refine your Looker Studio report. This can include adding charts, implementing filters, organizing content with containers, and refining the overall look of your report.
To see an example of a Looker Studio report featuring an embedded public Builder map, explore this report. And for a visual walkthrough, check out the below GIF displaying the example report in action.
Google Sites
Embedding a URL in a Google Sites allows you to integrate external web content directly into your site. To do so, follow these steps:
- Navigate to the Google Site where you want to embed the URL.
- Make sure you are in edit mode. You can enter edit mode by clicking on the pencil icon or the Edit button, depending on your version of Google Sites.
- Look for the Insert menu on the right side of the screen. Under this menu, you will find various elements you can add to your page. Click on Embed.
- In the Embed prompt, enter the embed code of your map:
<iframe width="640px" height="360px" src="https://clausa.app.carto.com/map/5d942679-411f-4ab7-0f6061c9af63"></iframe>
You can extend your Google Site by adding other components such as new pages, text, logos, etc. as in this example.
Ready to give this a try? We’ve put together this tutorial to help you do exactly this! By following the steps in the tutorial, you will be able to effectively embed your Builder maps into your favorite BI tool to help your audience uncover and communicate spatial insights at scale.
Want to learn more about how you can start visualizing and analyzing spatial data at scale in your data warehouse? Schedule a demo with one of our experts and get started today!
Editor's note: This post was originally published in 2024 and was refreshed in 2026 to reflect CARTO's latest Agentic GIS capabilities and current trends in spatial analytics.