Telecommunications
Build where demand is heading
Every telecom site and route has to justify its capex. Score them all on demand, coverage and cost, inside the cloud warehouse you already run.

Capex you can defend
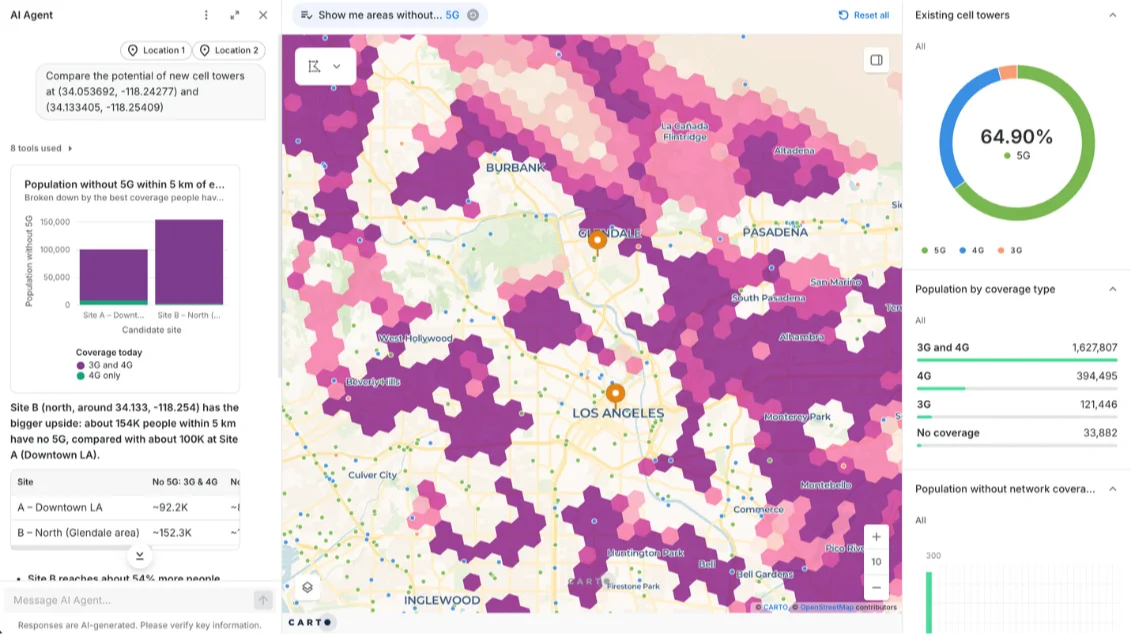
Analysis that lands after the decision is wasted, and rollout questions still take too long to answer. Let any planner rerun the numbers on live data as options change, and answer while the decision is open.

Scale without shortcuts
Network, signal and subscriber data runs to billions of points, more than desktop GIS and BI tools can handle without sampling. CARTO lets you analyze every point in your warehouse, so national coverage and rollout decisions rest on the full picture, not a sample.

Your data never moves
Every extra copy of network and subscriber data is another pipeline to maintain and another security review. CARTO runs inside your cloud warehouse, so nothing is copied or exported and your existing access controls still apply.




Get inspired by our customers


Using CARTO has enabled us to analyze service qualification at a much larger scale due to its comprehensive support for a wide range of functions and libraries including spatial indexes. This is a gamechanger, modernizing our GIS stack.



How it works
Spatial analysis where your network data already lives


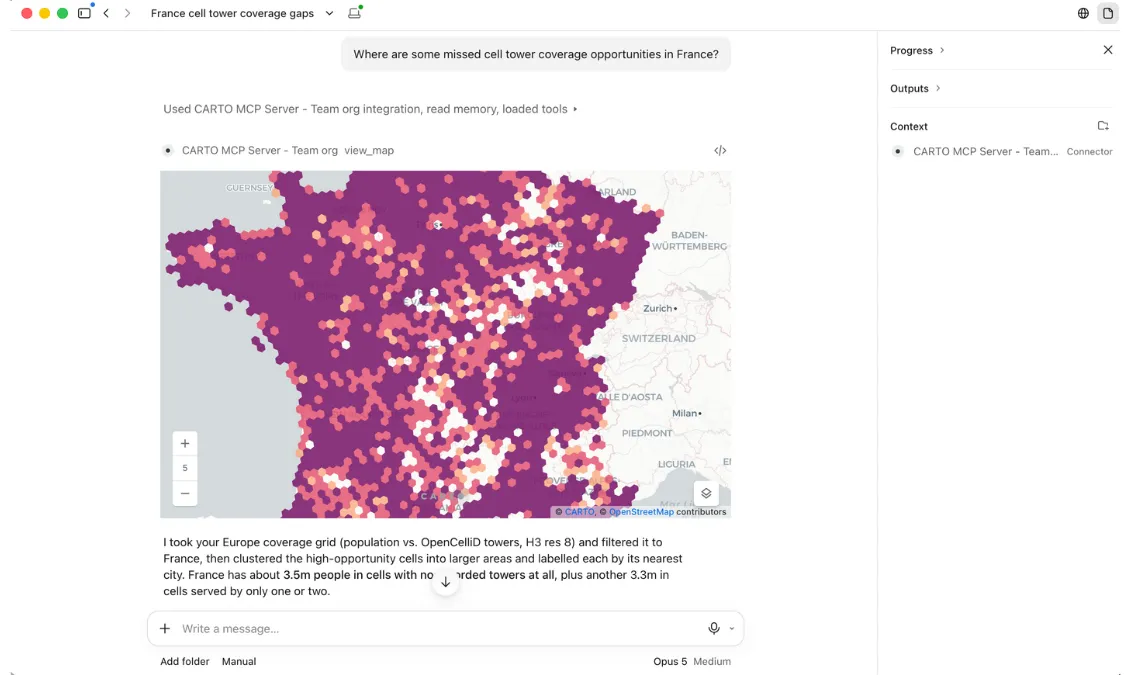
Where telecom teams use CARTO
Network Deployment & Planning
Every fiber or 5G build is a capex bet. When the data behind it sits in too many systems, decisions slow down and competing versions of the truth emerge.
CARTO lets you score every candidate route and site on demand, coverage and cost, in the warehouse you already run. One source of truth, shared as a live map, not last quarter's slide.
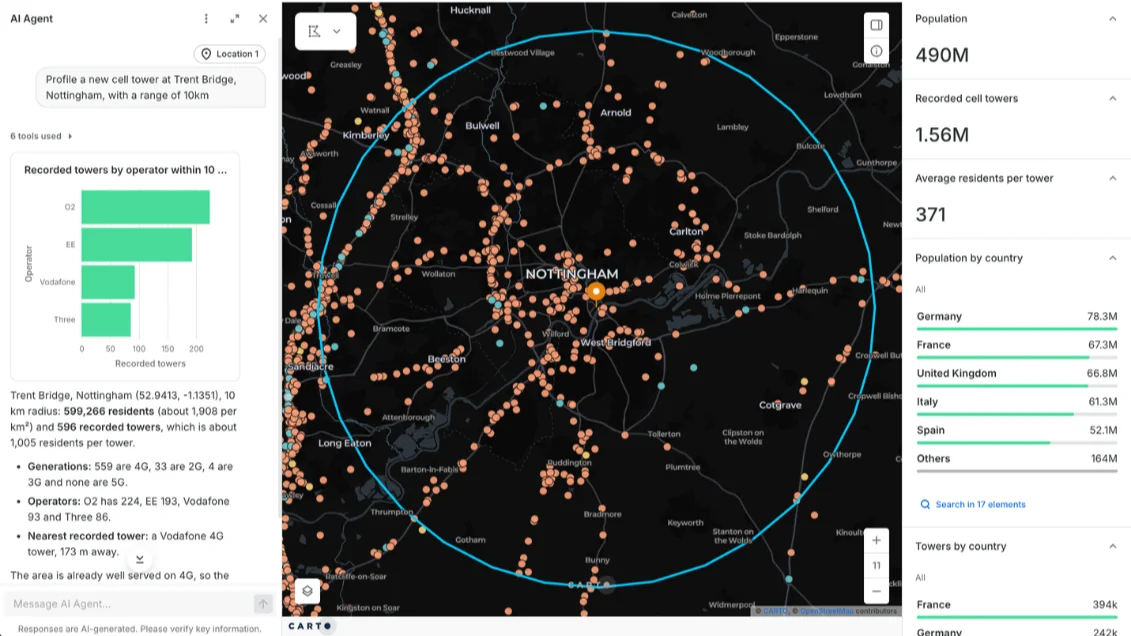
Coverage Planning
Coverage gaps hide inside regional averages, and every missed pocket is a customer a competitor can win.
With CARTO, you can combine population, signal and customer data at national scale without losing detail, with formats like spatial indexes. Fix the gaps that cost the most revenue first.
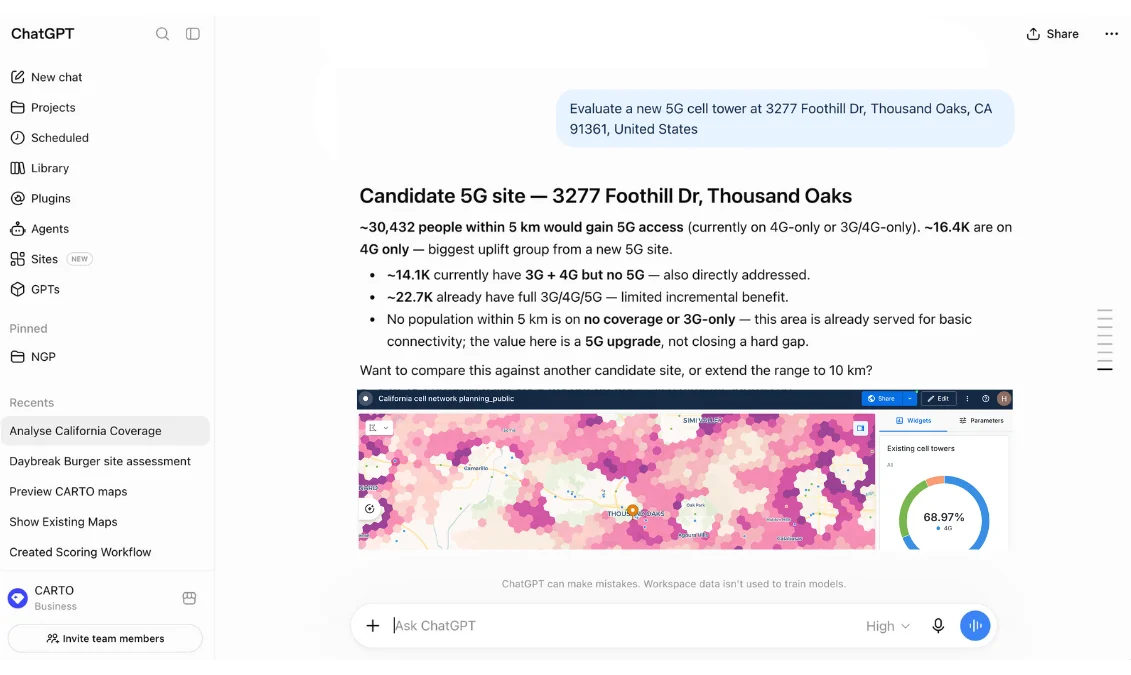
Market Opportunity
Sizing a new market means knowing who's served, who isn't and what each area is worth.
CARTO lets you join your footprint to ready-to-use population data from the Data Observatory directly inside your warehouse, so you can rank where to expand without sourcing third-party data first.
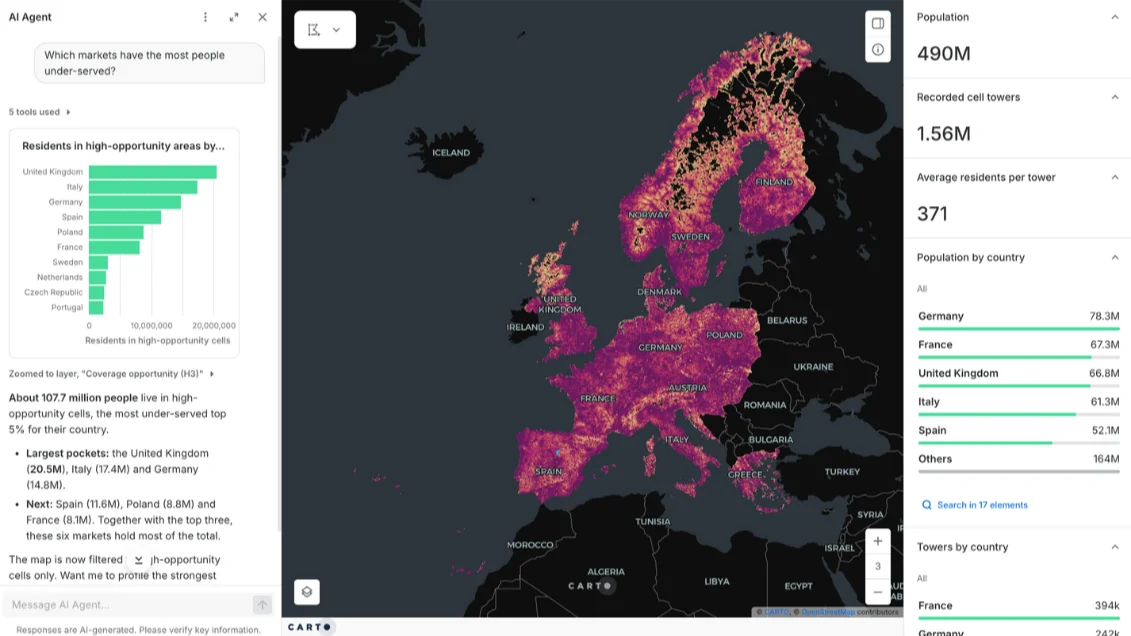
Capacity Planning & Demand Forecasting
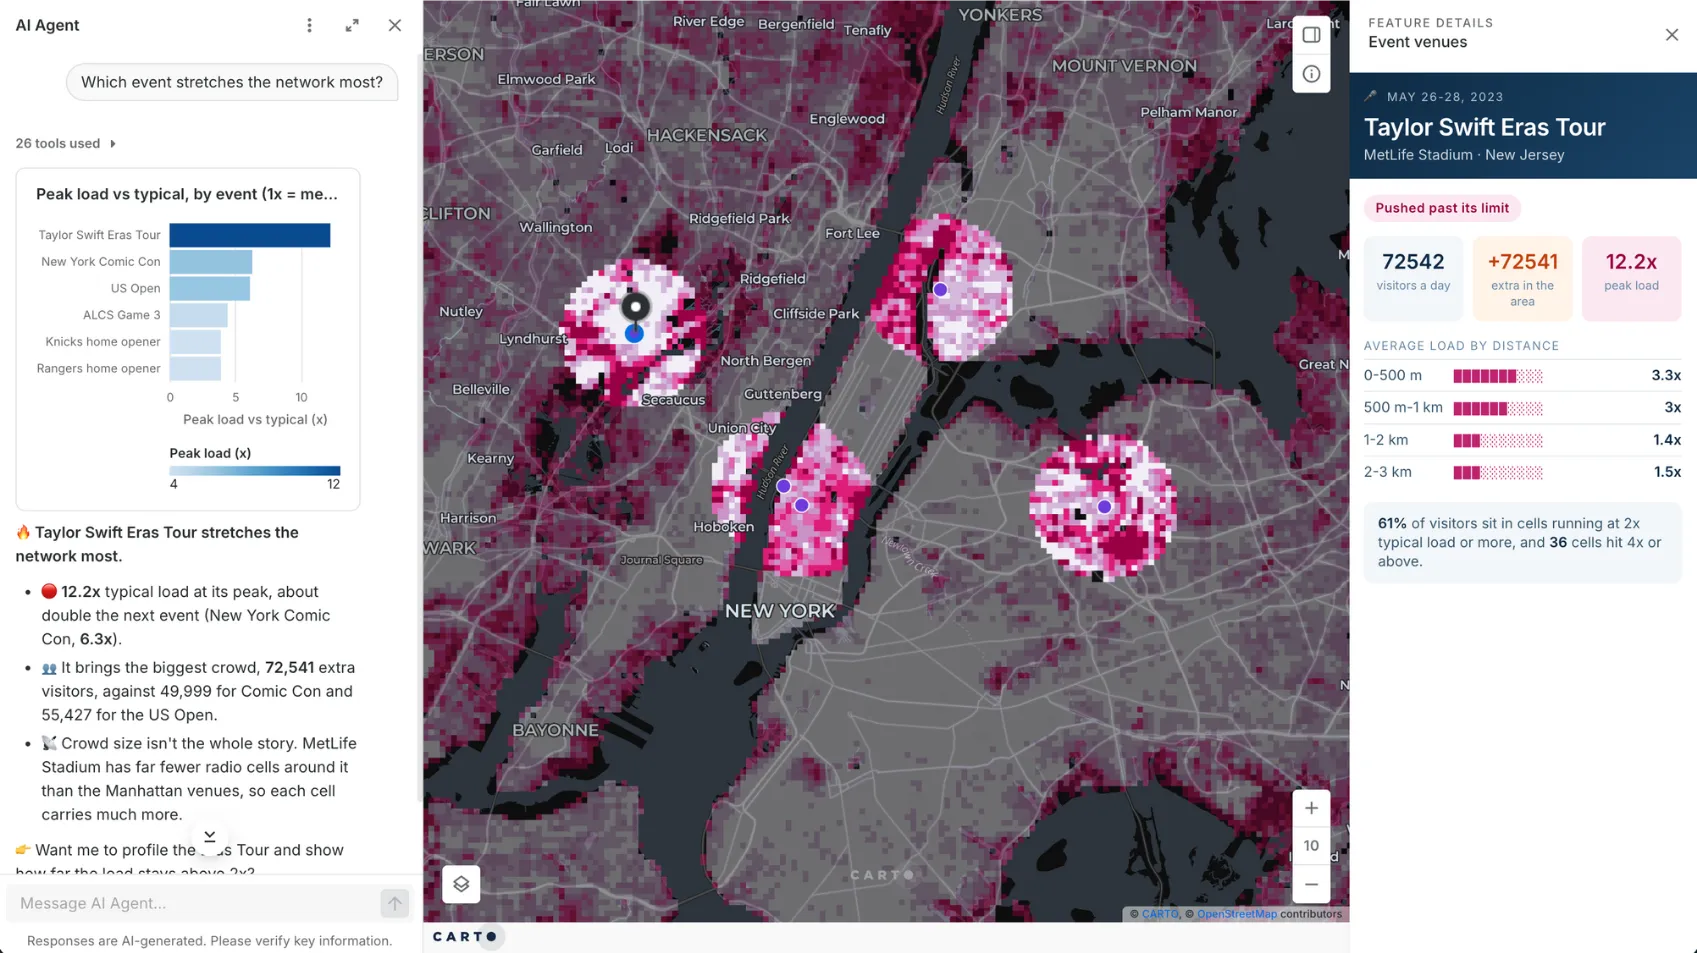
Demand grows unevenly, and a network planned on last year's averages runs short in its busiest areas first.
With CARTO, you can build demand forecasts as workflows that rerun as new traffic data lands, and stress-test peaks like stadium events. Add capacity before customers notice.
Site Consolidation
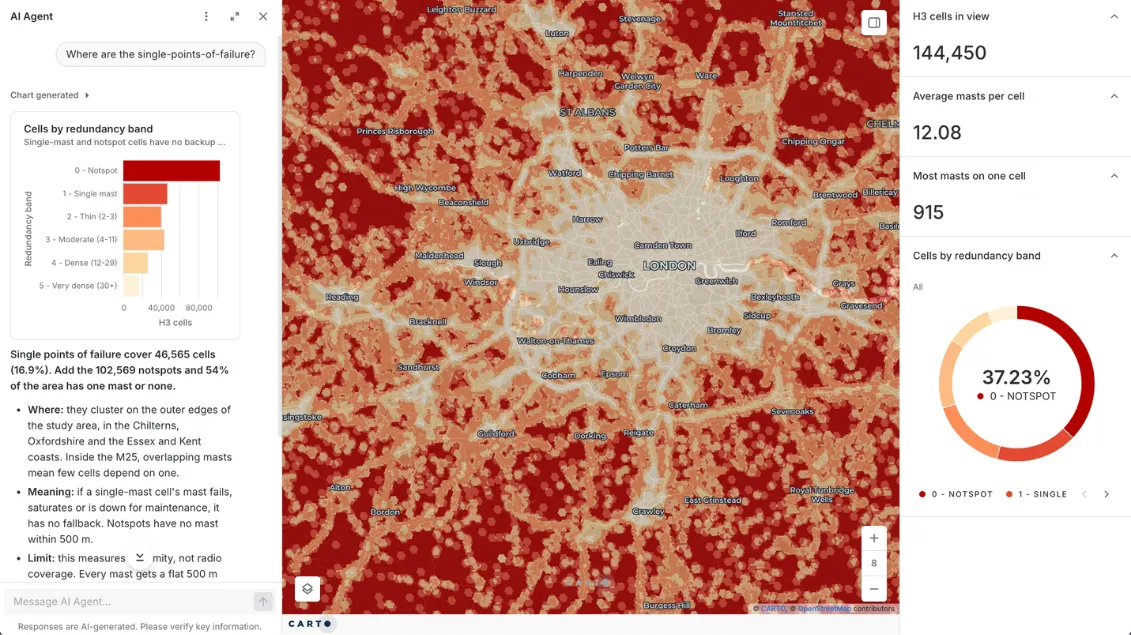
Every site costs money to run, but closing the wrong one leaves a hole in coverage.
CARTO lets you measure what each site covers and how much it overlaps its neighbors, then publish it with an AI Agent so finance and regional teams can test closures themselves.

Frequently asked questions
Yes. With CARTO, you run the analysis inside your existing cloud data warehouse (BigQuery, Snowflake, Redshift, Databricks, or Oracle). Data never moves, and the access controls, encryption and audit logging your security team already approved continue to apply. Teams that need it can also run CARTO in their own cloud.
For most analytical work, yes. Rollout scoring, coverage modeling and cannibalization analysis run natively in your warehouse at national scale, which desktop GIS and BI maps struggle to match. Because nothing is copied out to desktop files or extracts, your data stays under the security and governance controls you already have, with one governed copy instead of many. You can also keep your BI dashboards and embed CARTO maps in tools like Power BI and Tableau.
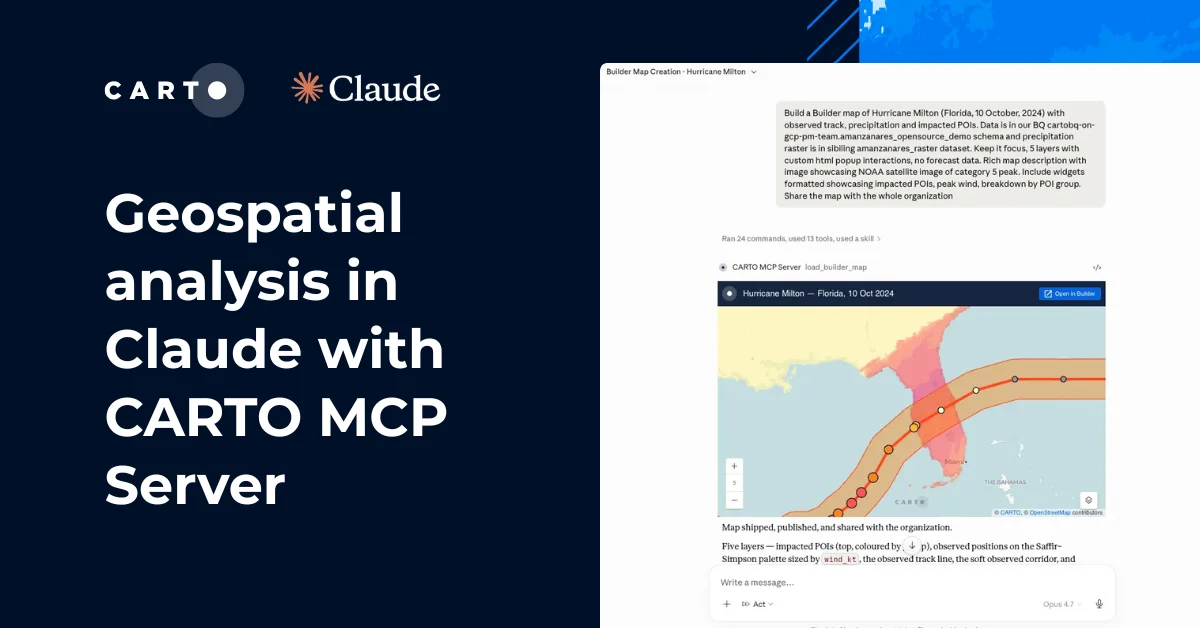
Yes. With CARTO for Agents, these platforms can build maps, run workflows, and query your warehouse. They are bound by the same permissions as the user who connects them, and every action is logged. Learn more about CARTO for Agents.
Telecom teams use GIS to map network assets, coverage, customers and competitors, then decide where to build, upgrade or close. With CARTO they run those analyses as repeatable workflows on live data: geosegmentation of customers by service quality, demand forecasting by area and hotspot analysis of outages, shared as interactive maps.
Network planning decides where to build, upgrade and retire capacity so supply matches demand. Almost every input has a location: population, traffic, terrain, towers and fiber routes. Spatial analysis turns those inputs into ranked decisions on which sites to add, which gaps to close first and which overlaps to remove.